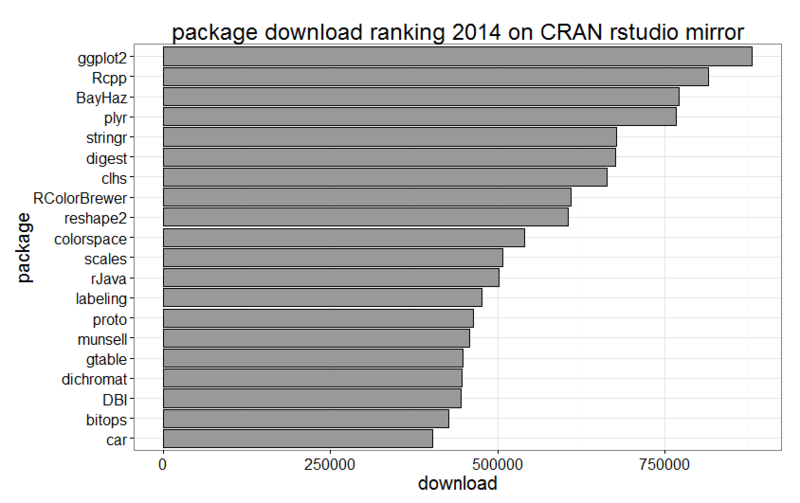
2014年のパッケージダウンロード数ランキング(CRAN rstudio mirror)
ちょっと調べる必要があったので,ついでにメモ.
installrパッケージで,CRAN rstudio mirrorのダウンロードログを取得して集計(上位20パッケージ).まあ,rstudio mirrorなので,全体からすると多少偏りはあると思います.

        package download
1       ggplot2   880791
2          Rcpp   815665
3        BayHaz   771257
4          plyr   767302
5       stringr   677974
6        digest   676556
7          clhs   663409
8  RColorBrewer   609341
9      reshape2   605751
10   colorspace   540774
11       scales   508104
12        rJava   502119
13     labeling   476075
14        proto   463113
15      munsell   457374
16       gtable   447665
17    dichromat   447135
18          DBI   445992
19       bitops   427203
20          car   403301
leafletRでシェープファイルからOSM上に塗り分け地図
Leaflet - a JavaScript library for mobile-friendly maps
というインタラクティブ地図のためのJavaScriptライブラリがある。GeoJSONファイルを用意して、leafletのスクリプトを書いてやれば、OpenStreetMapの上にインタラクティブ機能付きでデータを可視化できる。
これの作業をR上でやってくれるのがleafletRパッケージ。
福岡県の市町村別高齢化率(平成26年)の塗り分け地図(コロプレス図)を作成してみる。
# leafletRパッケージを使って、Shapefileから
# leafletJSを使ったインタラクティブな地図(コロプレス図)を作成
# leafletJS: http://leafletjs.com

library(leafletR)
library(rgdal)

tmp <- tempdir()

# 国土数値情報の行政界(平成26年度、福岡県)のシェープファイルを編集して、
# 各市町村の高齢化率を属性テーブルに追加した。
# 高齢化率は福岡県の高齢者人口及び高齢化率の推移
# (http://www.pref.fukuoka.lg.jp/contents/koureika-suii26-2.html)
# のエクセルファイルより取得。
url <- "http://stat.fwu.ac.jp/~fujino/hateblo/20150510/fukuoka.zip"

file <- basename(url)
download.file(url, file)
unzip(file, exdir=tmp)

# シェープファイルをSpatialPolygonsDataFrameとして取り込む
fukuoka <- readOGR(dsn=paste0(tmp,"/fukuoka"),
                        layer="fukuoka", encoding="Shift_JIS")

# GeoJSONオブジェクトに変換
# ちょっと時間がかかる
fukuoka.dat <- toGeoJSON(data=fukuoka, name="fukuoka", dest=tmp)

# スタイルの設定
# propは塗り分ける属性テーブルの列名、breaksは階級、
# style.valは階級の色、legは凡例のタイトル
fukuoka.style <- styleGrad(prop="agingrate", breaks=seq(10,40,by=5),
                    style.val=rev(heat.colors(6)), leg="Aging Rate",
                    fill.alpha=0.7, lwd=0.5)

# leafletJSのスクリプトを含むHTMLファイルを生成
# シェープファイルの属性テーブルにマルチバイト文字が含まれていて
# 文字コードがUTF-8でない場合にはここでエラーが出る
fukuoka.map <- leaflet(data=fukuoka.dat, dest=tmp, title="Aging Rate in Fukuoka",
                    base.map="osm", style=fukuoka.style, popup="*")
# ブラウザに表示
fukuoka.map
ポリゴンをクリックすると属性テーブルの情報がポップアップで表示される。

動くのは以下のリンクで。
Aging Rate in Fukuoka
githubで公開されているRStudioのleafletパッケージの方がポップアップのカスタマイズができたりと高機能な感じはするけど、まだ試していない。
gridSVGで散布図上の点のIdentification (2)
前回のエントリ
のサンプルを確認してみたら最新の環境ではうまくいかなかったので、アップデート。
grid.garnish("geom_point.points.1", onclick="info(evt)")
で点をクリックしたときのイベントを登録しても、出力のSVGに全く反映されない。とりあえずは以下のようにすれば、期待する結果が得られる。
grid.set("geom_point.points",
         garnishGrob(grid.get("geom_point.points"), onclick="info(evt)"))
grid.garnish()のオプションでも何とかなるかもしれないが、いまのところ原因は不明。ggplot2が出力するglobの構造が変わってる可能性があるかも。
もう1つはJavaScript。
id = e.target.correspondingUseElement.id;
chromeの最新版でcorrespondingUseElementがundefinedになってしまう。
id = e.target.id;
でうまくいく。単に使わなくすればよいだけ。以前のエントリでchromeのみで動作と書いたが、結果的にこれでfirefoxでもOKになった!でも当面はクロスブラウザ対策が必要かな。
全体のコードは以下。
pdf(file=NULL, width=7, height=5)

ggplot(iris, aes(Petal.Width, Petal.Length)) +
  geom_point(aes(colour=Species, size=Sepal.Width))

grid.script(paste("var x=", toJSON(iris$Petal.Width),";",sep=""))
grid.script(paste("var y=", toJSON(iris$Petal.Length),";",sep=""))

grid.script("
	info = function(e){
		id = e.target.id;
		id = parseInt(id.replace('geom_point.points.1.',''));
		alert('Petal.Width='+x[id-1]+'\\nPetal.Length='+y[id-1]);
	}
")

grid.gedit("geom_point.points", name="geom_point.points")
grid.set("geom_point.points",
         garnishGrob(grid.get("geom_point.points"), onclick="info(evt)"))

grid.export("iris_plot.svg")
dev.off()
gridSVGで散布図上の点のIdentification
gridSVG - Export grid graphics as SVG
gridSVGはgridライブラリによるグラフィックスをSVG形式で出力するためのライブラリ。ggplot2はgridを利用しているので、ggplot2の出力もSVGにできる。単に出力するだけでなくJavaScriptを埋め込むことができるので、インタラクティブな機能を実装できる。標準でもSVG出力はサポートしているが、プロットの構造は保持できないため、データに依存したインタラクティブ機能の実装が自動化できない。
散布図上の点をクリックするとその点の情報がalertで表示される例。Chromeで動く。Firefoxはuseタグの扱い(correspondingUseElement)が違うのでクロスブラウザ対策が必要。
library(ggplot2)
library(gridSVG)
library(grid)
library(rjson)

pdf(file=NULL, width=7, height=5)

ggplot(iris, aes(Petal.Width, Petal.Length)) +
	geom_point(aes(colour=Species, size=Sepal.Width))

grid.script(paste("var x=", toJSON(iris$Petal.Width),";",sep=""))
grid.script(paste("var y=", toJSON(iris$Petal.Length),";",sep=""))

grid.script("
	info = function(e){
		id = e.target.correspondingUseElement.id;
		id = parseInt(id.replace('geom_point.points.1.',''));
		alert('Petal.Width='+x[id-1]+'\\nPetal.Length='+y[id-1]);
	}
")

grid.gedit("geom_point.points", name="geom_point.points")
grid.garnish("geom_point.points", onclick="info(evt)")
grid.export("iris_plot.svg")

dev.off()

Rで統計API
統計APIの試験運用が始まったということで、Rから使ってみたのでメモ。
自治体独自の統計もこの形式に準拠できればいいかも。
次世代統計利用システム
http://statdb.nstac.go.jp/
使ったライブラリは以下の4つ。
library(RCurl)
library(rjson)
library(XML)
library(ggplot2)
統計表検索のための関数。
optionsには、検索パラメータ名と値の組のリストを与える。
appIdはサイトで登録して取得。
getStatList <- function(options){
	appId <- "hogehoge"
	URL <- "http://statdb.nstac.go.jp/rest/1.0/app/getStatsList?"
	appIdstring <- paste("appId", appId, sep="=")
	opstring <- paste(names(options), unlist(options), sep="=", collapse="&")

	result <- xmlToList(getURI(paste(URL, appIdstring, opstring, sep="&")))

	data.frame(do.call("rbind",sapply(result$DATALIST_INF, function(x){
		if(class(x)=="list") unlist(x)
	})))
}
データ取得のための関数。
statsDataIdに統計表IDを指定。
optionsには絞り込みのためのパラメータをリストで与える。
getDFfromStatAPI <- function(statsDataId, options=NULL){

	appId <- "hogehoge"
	URL <- "http://statdb.nstac.go.jp/rest/1.0/app/json/getStatsData?"
	appIdstring <- paste("appId", appId, sep="=")
	sdstring <- paste("statsDataId", statsDataId, sep="=")

	opstring <- paste(names(options), unlist(options), sep="=", collapse="&")

	data.json <- getURI(paste(URL, appIdstring, sdstring, opstring, sep="&"))
	data.list <- fromJSON(data.json)

	data <- data.frame(
		do.call("rbind", data.list$GET_STATS_DATA$STATISTICAL_DATA$DATA_INF$VALUE))
	names(data) <- gsub("X.", "", names(data))
	names(data)[ncol(data)] <- "X"

	classinf <- with(data.list$GET_STATS_DATA$STATISTICAL_DATA$CLASS_INF, {
		classinf <- list()
		for(i in 1:length(CLASS_OBJ)){
			classinf[[CLASS_OBJ[[i]]$`@id`]] <- list()
			classinf[[CLASS_OBJ[[i]]$`@id`]]$name <- CLASS_OBJ[[i]]$`@name`

			if(is.null(CLASS_OBJ[[i]]$CLASS$`@code`)){
				classinf[[CLASS_OBJ[[i]]$`@id`]]$code <- data.frame(
					do.call("rbind", CLASS_OBJ[[i]]$CLASS))
			} else {
				classinf[[CLASS_OBJ[[i]]$`@id`]]$code <- data.frame(
					do.call("cbind", CLASS_OBJ[[i]]$CLASS))
			}
		}
		classinf
	})

	data.df <- list()
	for(name in names(classinf)){
		data.df[[paste(classinf[[name]]$name,"コード",sep="")]] <- unlist(data[[name]])
		data.df[[classinf[[name]]$name]] <- unlist(
			classinf[[name]]$code$X.name[match(data[[name]], classinf[[name]]$code$X.code)])
	}

	data.df$X <- unlist(data$X)
	data.df$unit <- unlist(data$unit)

	as.data.frame(data.df)

}
2013年に公開された人口推計(政府統計コード:00200524)を検索。
search.result <- getStatList(list(statsCode="00200524", openYears="2013"))
参考表 年齢(各歳)(統計表ID: 0003080204)
日本人人口(050)、男女(001および002)、0歳から88歳まで(1000番台)
jinsui.df <- getDFfromStatAPI("0003080204", list(
	cdCat01="050", cdCat02="001,002",
	cdCat03From="01001", cdCat03To="01999"))

jinsui.df$年齢各歳コード <- as.numeric(as.character(jinsui.df$年齢各歳コード))
jinsui.df$X <- as.numeric(as.character(jinsui.df$X))
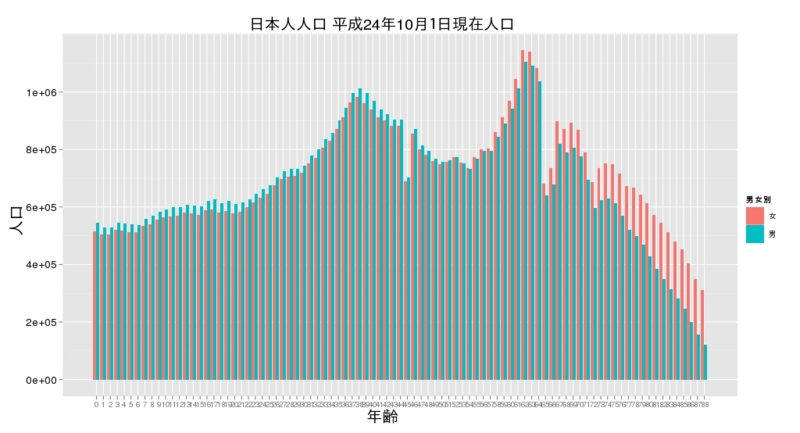
男女別人口のプロット。
qplot(as.factor(as.numeric(gsub("歳","",年齢各歳))), X,
	  geom="bar", stat="identity", position="dodge",fill=男女別,
	  data=jinsui.df, xlab="年齢", ylab="人口",
	  main="日本人人口 平成24年10月1日現在人口")
出力。

RApacheにおけるマルチバイト文字の利用について
RApacheでのマルチバイト文字(例えばUTF-8)を扱うには
Sys.setlocale(category='LC_ALL','ja_JP.UTF-8')
を実行しておく必要がある。これをやっておかないと、マルチバイト文字を含むファイルの読み込みや、iconvによる文字コード変換が正しく動作しない。
※ 参考 "UTF-8 characters in RApache"
https://groups.google.com/forum/?fromgroups=#!topic/rapache/V3IAIRhAybw
ある要素の子要素全てにアクセスする方法(SVG)
SVGでいくつかの要素をgタグでグループ化しているとき、getElementById()でgタグの要素を取得して、その子要素全てにアクセスする例。
childNodesで子ノードが取得できる。ノードにはテキストノード(text要素ではない)が含まれるので、nodeNameでノードの種類をチェックした上で処理を行う。
<?xml version="1.0" encoding="utf-8"?>
<svg xmlns="http://www.w3.org/2000/svg"
     xmlns:xlink="http://www.w3.org/1999/xlink"
	width="800" height="800"
     version="1.0" onload="init()">
<script type="text/javascript">
<![CDATA[
function init(){
	var group1 = document.getElementById("group1");
	var children = group1.childNodes;
	for(i=0;i<children.length;i++){
		if(children[i].nodeName=='circle'){
			children[i].style.setProperty('fill', '#00ff00');
		}
	}
}
]]>
</script>
<g id="group1">
	<circle cx="100" cy="100" r="50" style="fill: #ff0000" />
	<circle cx="200" cy="100" r="50" style="fill: #ff0000" />
	<circle cx="300" cy="100" r="50" style="fill: #ff0000" />
	<circle cx="400" cy="100" r="50" style="fill: #ff0000" />
</g>
<g id="group2">
	<circle cx="100" cy="200" r="50" style="fill: #ff0000" />
	<circle cx="200" cy="200" r="50" style="fill: #ff0000" />
	<circle cx="300" cy="200" r="50" style="fill: #ff0000" />
	<circle cx="400" cy="200" r="50" style="fill: #ff0000" />
</g>
</svg>