gridSVGで散布図上の点のIdentification
gridSVG - Export grid graphics as SVG
gridSVGはgridライブラリによるグラフィックスをSVG形式で出力するためのライブラリ。ggplot2はgridを利用しているので、ggplot2の出力もSVGにできる。単に出力するだけでなくJavaScriptを埋め込むことができるので、インタラクティブな機能を実装できる。標準でもSVG出力はサポートしているが、プロットの構造は保持できないため、データに依存したインタラクティブ機能の実装が自動化できない。
散布図上の点をクリックするとその点の情報がalertで表示される例。Chromeで動く。Firefoxはuseタグの扱い(correspondingUseElement)が違うのでクロスブラウザ対策が必要。
library(ggplot2)
library(gridSVG)
library(grid)
library(rjson)

pdf(file=NULL, width=7, height=5)

ggplot(iris, aes(Petal.Width, Petal.Length)) +
	geom_point(aes(colour=Species, size=Sepal.Width))

grid.script(paste("var x=", toJSON(iris$Petal.Width),";",sep=""))
grid.script(paste("var y=", toJSON(iris$Petal.Length),";",sep=""))

grid.script("
	info = function(e){
		id = e.target.correspondingUseElement.id;
		id = parseInt(id.replace('geom_point.points.1.',''));
		alert('Petal.Width='+x[id-1]+'\\nPetal.Length='+y[id-1]);
	}
")

grid.gedit("geom_point.points", name="geom_point.points")
grid.garnish("geom_point.points", onclick="info(evt)")
grid.export("iris_plot.svg")

dev.off()

Rで統計API
統計APIの試験運用が始まったということで、Rから使ってみたのでメモ。
自治体独自の統計もこの形式に準拠できればいいかも。
次世代統計利用システム
http://statdb.nstac.go.jp/
使ったライブラリは以下の4つ。
library(RCurl)
library(rjson)
library(XML)
library(ggplot2)
統計表検索のための関数。
optionsには、検索パラメータ名と値の組のリストを与える。
appIdはサイトで登録して取得。
getStatList <- function(options){
	appId <- "hogehoge"
	URL <- "http://statdb.nstac.go.jp/rest/1.0/app/getStatsList?"
	appIdstring <- paste("appId", appId, sep="=")
	opstring <- paste(names(options), unlist(options), sep="=", collapse="&")

	result <- xmlToList(getURI(paste(URL, appIdstring, opstring, sep="&")))

	data.frame(do.call("rbind",sapply(result$DATALIST_INF, function(x){
		if(class(x)=="list") unlist(x)
	})))
}
データ取得のための関数。
statsDataIdに統計表IDを指定。
optionsには絞り込みのためのパラメータをリストで与える。
getDFfromStatAPI <- function(statsDataId, options=NULL){

	appId <- "hogehoge"
	URL <- "http://statdb.nstac.go.jp/rest/1.0/app/json/getStatsData?"
	appIdstring <- paste("appId", appId, sep="=")
	sdstring <- paste("statsDataId", statsDataId, sep="=")

	opstring <- paste(names(options), unlist(options), sep="=", collapse="&")

	data.json <- getURI(paste(URL, appIdstring, sdstring, opstring, sep="&"))
	data.list <- fromJSON(data.json)

	data <- data.frame(
		do.call("rbind", data.list$GET_STATS_DATA$STATISTICAL_DATA$DATA_INF$VALUE))
	names(data) <- gsub("X.", "", names(data))
	names(data)[ncol(data)] <- "X"

	classinf <- with(data.list$GET_STATS_DATA$STATISTICAL_DATA$CLASS_INF, {
		classinf <- list()
		for(i in 1:length(CLASS_OBJ)){
			classinf[[CLASS_OBJ[[i]]$`@id`]] <- list()
			classinf[[CLASS_OBJ[[i]]$`@id`]]$name <- CLASS_OBJ[[i]]$`@name`

			if(is.null(CLASS_OBJ[[i]]$CLASS$`@code`)){
				classinf[[CLASS_OBJ[[i]]$`@id`]]$code <- data.frame(
					do.call("rbind", CLASS_OBJ[[i]]$CLASS))
			} else {
				classinf[[CLASS_OBJ[[i]]$`@id`]]$code <- data.frame(
					do.call("cbind", CLASS_OBJ[[i]]$CLASS))
			}
		}
		classinf
	})

	data.df <- list()
	for(name in names(classinf)){
		data.df[[paste(classinf[[name]]$name,"コード",sep="")]] <- unlist(data[[name]])
		data.df[[classinf[[name]]$name]] <- unlist(
			classinf[[name]]$code$X.name[match(data[[name]], classinf[[name]]$code$X.code)])
	}

	data.df$X <- unlist(data$X)
	data.df$unit <- unlist(data$unit)

	as.data.frame(data.df)

}
2013年に公開された人口推計(政府統計コード:00200524)を検索。
search.result <- getStatList(list(statsCode="00200524", openYears="2013"))
参考表 年齢(各歳)(統計表ID: 0003080204)
日本人人口(050)、男女(001および002)、0歳から88歳まで(1000番台)
jinsui.df <- getDFfromStatAPI("0003080204", list(
	cdCat01="050", cdCat02="001,002",
	cdCat03From="01001", cdCat03To="01999"))

jinsui.df$年齢各歳コード <- as.numeric(as.character(jinsui.df$年齢各歳コード))
jinsui.df$X <- as.numeric(as.character(jinsui.df$X))
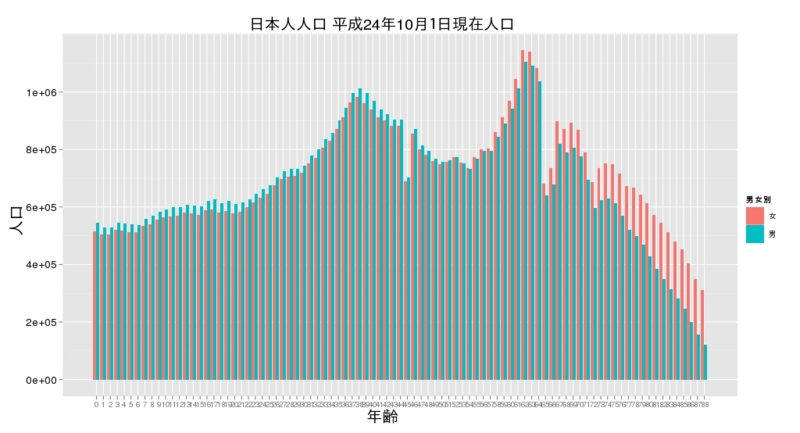
男女別人口のプロット。
qplot(as.factor(as.numeric(gsub("歳","",年齢各歳))), X,
	  geom="bar", stat="identity", position="dodge",fill=男女別,
	  data=jinsui.df, xlab="年齢", ylab="人口",
	  main="日本人人口 平成24年10月1日現在人口")
出力。

RApacheにおけるマルチバイト文字の利用について
RApacheでのマルチバイト文字(例えばUTF-8)を扱うには
Sys.setlocale(category='LC_ALL','ja_JP.UTF-8')
を実行しておく必要がある。これをやっておかないと、マルチバイト文字を含むファイルの読み込みや、iconvによる文字コード変換が正しく動作しない。
※ 参考 "UTF-8 characters in RApache"
https://groups.google.com/forum/?fromgroups=#!topic/rapache/V3IAIRhAybw
ある要素の子要素全てにアクセスする方法(SVG)
SVGでいくつかの要素をgタグでグループ化しているとき、getElementById()でgタグの要素を取得して、その子要素全てにアクセスする例。
childNodesで子ノードが取得できる。ノードにはテキストノード(text要素ではない)が含まれるので、nodeNameでノードの種類をチェックした上で処理を行う。
<?xml version="1.0" encoding="utf-8"?>
<svg xmlns="http://www.w3.org/2000/svg"
     xmlns:xlink="http://www.w3.org/1999/xlink"
	width="800" height="800"
     version="1.0" onload="init()">
<script type="text/javascript">
<![CDATA[
function init(){
	var group1 = document.getElementById("group1");
	var children = group1.childNodes;
	for(i=0;i<children.length;i++){
		if(children[i].nodeName=='circle'){
			children[i].style.setProperty('fill', '#00ff00');
		}
	}
}
]]>
</script>
<g id="group1">
	<circle cx="100" cy="100" r="50" style="fill: #ff0000" />
	<circle cx="200" cy="100" r="50" style="fill: #ff0000" />
	<circle cx="300" cy="100" r="50" style="fill: #ff0000" />
	<circle cx="400" cy="100" r="50" style="fill: #ff0000" />
</g>
<g id="group2">
	<circle cx="100" cy="200" r="50" style="fill: #ff0000" />
	<circle cx="200" cy="200" r="50" style="fill: #ff0000" />
	<circle cx="300" cy="200" r="50" style="fill: #ff0000" />
	<circle cx="400" cy="200" r="50" style="fill: #ff0000" />
</g>
</svg>
mencoderでogvからwmvへ変換
recordMyDesktopで録ったスクリーンキャストをpowerpointのスライドに取り込むために、wmvに変換。
$ mencoder hogehoge.ogv -o fugafuga.wmv -ovc lavc -lavcopts vcodec=wmv2
SVGの要素をHTMLのフォームパーツで操作する
objectタグで適当なidをつけてSVGを埋め込んで、
document.getElementById('hogehoge').contentDocument;
で、SVGDocumentを取得。あとは、SVGに対するJavaScriptを記述すればよい。
<html>
<head>
<meta http-equiv="Content-Type" content="text/html; charset=utf-8">
<title>traffic light</title>
<script type="text/javascript">
var now = 'blue';
var svg;
function init(){
	svg = document.getElementById("testsvg").contentDocument;
	switch_on(now);
}

function switch_on(col){
	var circle = svg.getElementById(now);
	circle.style.setProperty('fill', '#999999');
	circle = svg.getElementById(col);
	circle.style.setProperty('fill', col);
	now = col;

}
</script>
</head>
<body onload="init()">
<h1>traffic light</h1>
<object id="testsvg" data="test.svg" type="image/svg+xml" width="600px" height="200px"> </object>
<p>
<input type="radio" name="switch" value="blue" onclick="switch_on(this.value);" checked>Blue
<input type="radio" name="switch" value="yellow" onclick="switch_on(this.value);">Yellow
<input type="radio" name="switch" value="red" onclick="switch_on(this.value);">Red
</p>
</body>
</html>
SVGのコードは以下のとおり。
<?xml version="1.0" encoding="UTF-8"?>
<svg xmlns="http://www.w3.org/2000/svg"
     xmlns:xlink="http://www.w3.org/1999/xlink"
     width="600px"
     height="200px"
     version="1.0">
<circle id="blue" cx="100" cy="100" r="100" style="fill:#999999" />
<circle id="yellow" cx="300" cy="100" r="100" style="fill:#999999" />
<circle id="red" cx="500" cy="100" r="100" style="fill:#999999" />
</svg>
MacOSXでiplotsを使う
iplotsはJGR(Java GUI for R)の中で動作するので、JGRのインストールも必要。
install.packages("iplots")
install.packages("JGR")
さらに、CarbonELパッケージも必要。これはinstall.packagesでインストールできないので、CarbonELのダウンロードページからCarbonEL_0.1-4.tgzをダウンロードして解凍、できたフォルダをライブラリのフォルダ(/Library/Frameworks/R.framework/Versions/2.15/Resources/library など)にコピーする。次に、
Sys.setenv(NOAWT=1)
library(JGR)
JGR()
これでJGRのコンソールが起動して、iplotsが利用できるようになる。Sys.setenvを実行しないとエラーとなる。